Easy as Pie /
Growing, Growing, Gone

(sugar, sprinkles, dried beans, barley, granola, wild rice, white rice and string, 12’x4’8.5’, October 2012)
"Growing, Growing, Gone/Easy as Pie" are two completely different ways at viewing and understanding one piece.
The first, Growing, Growing, Gone is a comparison of the average weight of 10 year children in the United States in 1963 and 2002, where the average weight changed from approximately 75lbs. To 135lbs., a 60lb increase! The actual piece shows 2.7oz in 1963 and 4.8oz in 2002, where 1gram = 1 pound
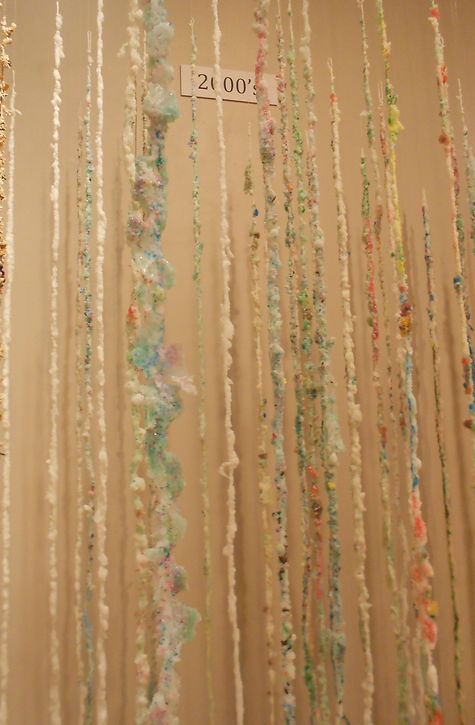
The second, Easy as Pie is essentially a pie graph, where 1 hanging line = 1% of the population. The piece consists of 100 hanging lines which together equal 100% of the population.
This immersive pie chart shows the population separated into four categories with the underweight (5%) represented in white rice, those deemed “normal” (19%) represented by an earthy bean mixture, overweight (15%) represented in white sugar and obese (61%) represented in a colorful sugar and sprinkle mixture.